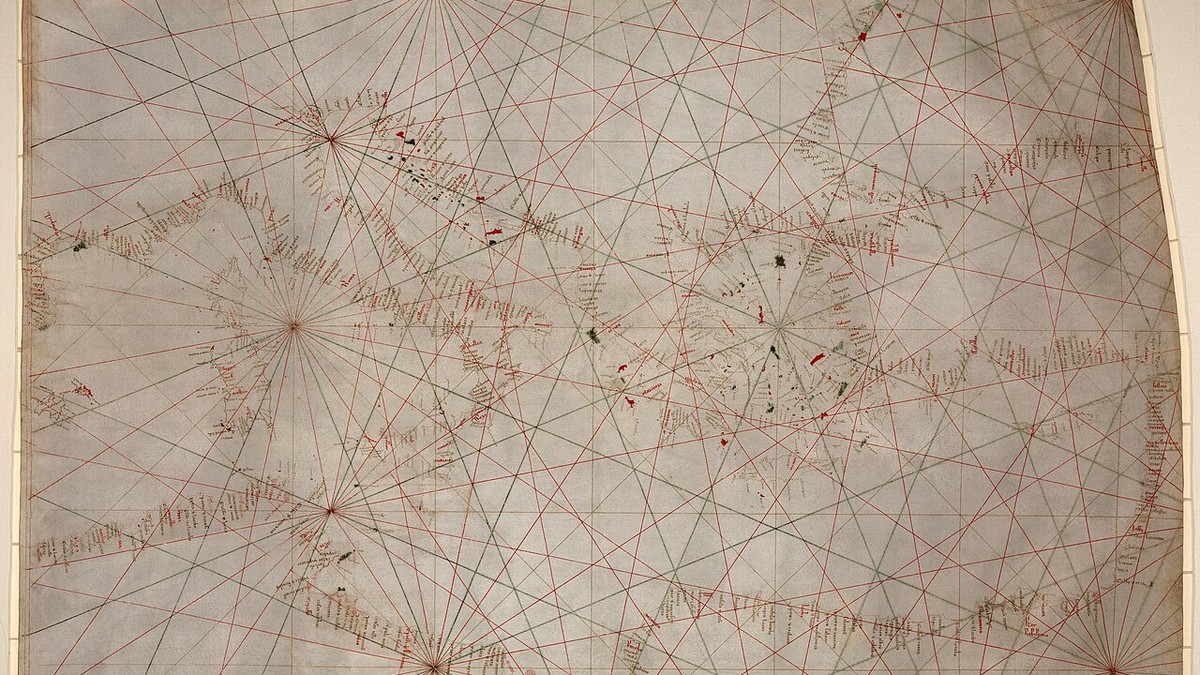
⚓ Monograph Overview: The Science of Mapping the Oceans
From thirteenth-century vellum Portolan charts crisscrossed with rhumb lines to Gerardus Mercator’s revolutionary 1569 conformal cylindrical projection and deep-sea lead line bathymetry, nautical cartography transformed the sea from a space of mortal peril into a charted highway. This monograph investigates the mathematical, optical, and hydrographic breakthroughs that enabled navigators to plot precise courses across global ocean basins.
A nautical chart is fundamentally distinct from a terrestrial map. While a topographic map serves to depict terrestrial features, elevations, political boundaries, and land-use patterns, a nautical chart is an active working instrument of mathematical calculation and life-or-death risk management. A navigator does not merely look at a nautical chart; they draw upon it, plotting projected courses, calculating dead-reckoning vectors, applying compass variation, and measuring margins of safety against invisible underwater hazards.
For millennia, early mariners relied upon descriptive oral itineraries or written sailing directions known in the Mediterranean as periplus. These texts recorded coastal headlands, harbor approaches, prevailing winds, and anchorages, but lacked any geometric representation of space. The emergence of true mathematical cartography required two profound scientific convergences: the integration of the magnetic compass into European navigation during the thirteenth century, and the mathematical resolution of projecting the spherical, three-dimensional surface of planet Earth onto a flat, two-dimensional sheet of paper.
1. The Portolan Charts of the Medieval Mediterranean
The earliest true nautical charts surviving in the historical record are the Portolan charts (from the Italian portolano, meaning ‘a pilot book or harbor manual’). Emerging in northern Italy and the Balearic Islands during the late thirteenth century—epitomized by the legendary Carta Pisana (c. 1275–1290)—Portolan charts represented a radical leap into empirical realism. Drawn with meticulous precision on whole animal skins (vellum or calfskin parchment), they depicted the coastlines of the Mediterranean and Black Seas with an architectural fidelity that astounds modern hydrographers.
The definitive visual feature of Portolan charts is the intricate geometric web of radiating lines that crisscross the parchment, known as rhumb lines (or loxodromes). These lines emanated outward from an array of 16- or 32-point compass roses distributed across the chart. Unlike modern charts based on latitude and longitude coordinates, Portolan charts were constructed entirely around magnetic compass bearings and estimated sailing distances between ports.
Navigation with Dividers and Magnetic Bearings
To navigate using a Portolan chart, a medieval galley master or merchant captain required only a pair of brass dividers and a magnetic compass. The mariner located their departure port and intended destination, identified the rhumb line running parallel to that vector, and aligned the ship’s compass to that specific bearing. By stepping their dividers along the graphic distance scale provided on the margin of the vellum, the pilot could calculate progress day by day.
However, Portolan charts possessed two inherent mathematical limitations. First, they were drawn without consideration for terrestrial curvature, functioning accurately only over enclosed, regional seas like the Mediterranean where spherical distortion was minimal. Second, they ignored magnetic declination (the angular difference between magnetic north indicated by the compass needle and true geographic north), leading to cumulative errors when extended into the vast expanses of the Atlantic Ocean.
| Cartographic Epoch | Primary Projection Method | Coordinate Grid System | Navigational Utility | Distortion Characteristics |
|---|---|---|---|---|
| Portolan Charts (13th–15th C.) | Plane chart (No mathematical projection) | Radiating rhumb line networks (Wind roses) | Direct point-to-point magnetic heading plotting | Severe distortion when scaled beyond regional basins |
| Early Atlantic Plane Charts | Equirectangular projection | Linear equidistant latitude and longitude lines | Primitive ocean crossing plotting | Convergence of meridians ignored; extreme east-west distortion |
| Mercator Projection (1569) | Conformal cylindrical projection | Rectangular grid; variable latitude spacing | Straight lines represent lines of constant bearing (loxodromes) | Massive landmass area distortion toward poles (Greenland problem) |
| Gnomonic Projection (19th C.) | Perspective from center of globe to tangent plane | Curved latitude/longitude; straight great circles | Plotting shortest great-circle oceanic routes | Extreme angular and area distortion away from tangent point |
| Modern Electronic Nav Charts (ENC) | WGS 84 Ellipsoidal datum / Vector bathymetry | Global digital GPS coordinate matrix | Real-time satellite positioning & dynamic soundings | Zero optical distortion; dependent on digital power & sensors |
2. The Problem of the Sphere: The Mercator Breakthrough (1569)
As the European Age of Discovery pushed Portuguese, Spanish, and English expeditions across the Atlantic, Indian, and Pacific Oceans, traditional plane charts became dangerously obsolete. Because the Earth is an oblate spheroid, lines of longitude (meridians) are not parallel; they converge progressively from their widest separation at the equator to absolute points at the North and South Poles.
When navigators attempted to plot a straight-line compass course on a standard flat plane chart, they were navigating by a rhumb line (a line that crosses all meridians at the same constant angle). On a sphere, however, a rhumb line does not follow a straight path; it spirals infinitely toward the poles. Conversely, the shortest physical distance between two points on a globe is an arc of a great circle, which continuously changes its compass bearing. If a pilot plotted a straight course on an ordinary plane chart, their ship would slowly curve off course, resulting in catastrophic navigational drift.
Gerardus Mercator’s 1569 Masterpiece
The mathematical resolution to this existential crisis was achieved in 1569 by Flemish cartographer and mathematician Gerardus Mercator (Gerhard Kremer) in his monumental 18-sheet world chart entitled Nova et Aucta Orbis Terrae Descriptio ad Usum Navigantium Emendate Accommodata (‘A New and More Complete Description of the Terrestrial Globe Properly Adapted for the Use of Navigation’).
Mercator conceived a brilliant conformal cylindrical projection. He mathematically projected the globe onto an encompassing cylinder tangent at the equator. Recognizing that stretching lines of longitude into parallel vertical lines introduced progressive east-west distortion toward the poles, Mercator applied an equal, proportional stretching to the lines of latitude (parallels) as they approached the poles.
Mercator Condition: ∂y/∂φ = sec(φ) ⇒ y(φ) = ln |tan(π/4 + φ/2)|
The consequence of this mathematical formula was miraculous for mariners: on a Mercator chart, every straight line drawn between two points represents a true loxodrome (a course of constant compass bearing). A navigator no longer needed to recalculate their heading as they crossed meridians; they simply drew a straight pencil line between their harbor and destination, measured the angle of that line relative to any vertical meridian using a parallel ruler, and steered that exact compass bearing until making landfall.
⚓ Cartographic Paradox: The Price of Conformal Bearing
While Mercator charts are indispensable for marine navigation because they preserve true local angles and bearings (conformality), they drastically distort geographic area as distance from the equator increases. High-latitude landmasses appear gargantuan: Greenland appears roughly equal in size to the entire continent of Africa, even though Africa is physically fourteen times larger.
3. Bathymetric Sounding: Mapping the Ocean Floor
A nautical chart is useless—and actively lethal—if it fails to accurately record the topography of the unseen seabed beneath the ship’s keel. The history of hydrography is inextricably bound to the science of bathymetric sounding: measuring the vertical depth of water and identifying submerged reefs, shoals, shipwrecks, and sandbanks.
For over two thousand years, the primary instrument of marine depth sounding was the lead line (or sounding plumb). The sounding apparatus consisted of a heavy, tapered lead weight (weighing between 7 and 14 pounds for hand-lead lines, and up to 50 pounds for deep-sea leads) attached to a long, braided hemp line marked with colored rags, leather strips, and knotted cords at standardized intervals of fathoms (one fathom equals exactly six feet or 1.83 meters).
Arming the Lead: Geological Sampling of the Seabed
In addition to measuring depth, the sounding lead performed an essential geological diagnostic function through a technique known as ‘arming the lead’. The hollow base of the lead weight was scooped out and filled with sticky tallow (cured animal fat) or wax.
When the lead struck the seabed, sediments adhered to the tallow. When the leadsman hauled the line back to the deck, the pilot examined the sample—fine white sand, gray mud, black gravel, broken shells, or yellow clay. By cross-referencing both the water depth and the seabed soil type against the annotations on their hydrographic chart, an experienced pilot could deduce their precise position in blinding fog or pitch-black night, identifying their approach to the English Channel or the sandbanks of the Thames Estuary.
4. The Industrial Hydrographic Revolution: British Admiralty Charts
The golden age of institutional nautical cartography dawned in 1795 with the establishment of the Hydrographic Office of the British Admiralty, headed by legendary hydrographer Alexander Dalrymple and subsequently elevated by Sir Francis Beaufort (creator of the Beaufort Wind Scale). Recognizing that naval supremacy required flawless hydrographic intelligence, the Royal Navy dispatched specialized surveying vessels across the globe.
Survey ships, such as HMS Beagle under Captain Robert FitzRoy (carrying naturalist Charles Darwin), conducted systematic triangulation surveys of South America, the Pacific, and Africa. Using the newly invented station pointer—a three-armed circular protractor that allowed hydrographers to instantly plot three-point sextant horizontal angles taken from shore landmarks—surveyors mapped bays, anchorages, and shoals with millimeter precision.
Standardized Symbology and Copperplate Engraving
Admiralty charts set the global benchmark for cartographic clarity. Master engravers etched bathymetric soundings, hazard crosses (+ for submerged rocks), drying heights, lighthouse light-character sectors, and tidal stream diamonds onto massive copper plates. Printed on heavy rag paper, millions of Admiralty charts were issued to merchant and naval fleets worldwide, dramatically reducing international shipwreck rates throughout the nineteenth and twentieth centuries.
5. From Acoustic Echo Sounders to Modern Vector Electronic Charts
The twentieth century brought an electronic transformation to nautical cartography. In the 1920s, the invention of the acoustic echo sounder (sonar) replaced manual lead lines. By transmitting ultrasonic sound pulses toward the seabed and timing their reflection back to the hull transducer, vessels could generate continuous bathymetric profiles while traveling at full speed, revealing deep submarine canyons and submerged oceanic trenches.
In the twenty-first century, nautical cartography has migrated entirely into digital vectors. Modern vessels operate under the international ECDIS (Electronic Chart Display and Information System) standards mandated by the International Maritime Organization (IMO). Electronic Navigational Charts (ENCs), built upon the global WGS 84 geodetic datum, continuously integrate real-time satellite GPS positioning, bathymetric multibeam sonar data, dynamic tidal levels, and radar overlays.
Yet despite the brilliance of glowing bridge displays and automated collision warnings, every vector electronic chart remains the direct mathematical descendant of the medieval Portolan mariners who first inked rhumb lines across calfskin parchment, and of Gerardus Mercator, who bent the geometry of the sphere to guide humanity across the boundless ocean.
6. The Great Trigonometrical Coastal Surveys and the Station Pointer
The transition from artistic coastal sketches to mathematical hydrographic charts occurred during the late eighteenth century through the development of the triangulation coastal survey. Led by pioneer hydrographers like Murdoch Mackenzie and Alexander Dalrymple, surveyors established a baseline of measured length on a flat beach using metal chains or glass rods. From both ends of this baseline, theodolites measured the horizontal angles to prominent coastal peaks, church steeples, and lighthouses, creating an unbroken network of trigonometric triangles across the coast.
To transfer these angles to sounding boats operating offshore, Scottish inventor Alexander Adie invented the station pointer in 1774. Consisting of a graduated circular brass ring fitted with one fixed index arm and two rotating movable arms, the station pointer allowed a hydrographer to measure two horizontal angles between three shore landmarks using a sextant. By setting those angles on the station pointer’s brass arms and laying the instrument on the chart until the three arms aligned with the mapped landmarks, the ship’s position was plotted instantly through resection geometry, ensuring that every depth sounding was mapped with pinpoint geodetic accuracy.
| Hydrographic Survey Phase | Instruments Employed | Mathematical Principle | Cartographic Data Produced |
|---|---|---|---|
| Shoreline Triangulation | Theodolite, surveyor’s chain, baseline | Sine Rule triangulation (Δ ABC) | Geodetic framework of coastal reference monuments |
| Horizontal Sextant Angles | Nautical sextant held horizontally | Three-point resection problem | Simultaneous angular fix between 3 shore stations |
| Station Pointer Plotting | Three-arm circular brass station pointer | Mechanical geometric resection intersection | Precise coordinate fix of sounding boat in harbor |
| Lead Line Bathymetry | Sounding lead with tallow arming | Vertical hydrostatic depth sounding | Depth soundings & seabed substrate classifications |